Are you in the last year of an IVA and have a house with equity? You may have to try to remortgage your house or get a secured loan to pay some of the equity into your IVA. This is called "equity release" This article looks at the questions people have about how equity release works in an IVA. An IVA that starts from July 2025 will probably be under the "2025 Protocol". This says that there … [Read more...]
Articles about what happens in an IVA
 This page, and the following ones, list all Debt Camel articles about the practical aspects of IVA - from what happens at your first annual review to what you can expect after you make your last payment.
What is an IVA and how do they work? gives an overview for anyone thinking of starting an IVA. IVAs are great options for some people, but they are too often "sold" as an easy, affordable option to people who have better alternatives for sorting out their debts. Do your research!
If you are interested in debt policy and news, look at the IVA News Archive.
What happens when you can’t afford IVA payments

If you can't make the payment to your Individual Voluntary Arrangement (IVA) this month, don't panic! There may be options for you to cope and get your IVA back on track. This is very common - five or six years is a long time for everything to go smoothly in your life. You do need to talk to your IVA firm,even if you know the problem is very temporary and you can pay a few weeks late. If … [Read more...]
How much should I offer to settle my IVA early?

An Individual Voluntary Agreement (IVA) is a formal, legal contract for a set period, usually five or six years. To finish your IVA sooner and have the remainder of your debts written off, you need to talk to your IVA firm, say how much you are offering and where the money is coming from. Your creditors will need to approve this offer. How much you should offer as a Full and Final (F&F) … [Read more...]
IVA scammers pretending to be bailiffs or the FCA

If you get an email entitled LEGAL NOTICE OF ATTACHMENT OF EARNINGS that sounds very alarming... But this may be the start of a scam and the sender wants you to panic so you will make a bad decision. An example of a scam email Here is one such email: This is xxxxxx from CBL ( Collection Bailiffs Limited ). Hope you are doing well. I just would like to tell you that we have got a legal … [Read more...]
Car finance – what happens in an IVA?

Cars on finance can be a big problem with an Individual Voluntary Arrangement (IVA). Sometimes they can cause difficulty getting the IVA approved. Sometimes you face a major problem when the car finance end. With more than a million cars a year in the UK being bought on finance, this is an increasingly common situation. And one that is being made worse in 2023 by the cost of getting a … [Read more...]
IVA mis-selling must stop – FCA finally acts to ban debt packagers

Many people have been mis-sold IVAs when they had a better (cheaper, quicker, less risky) debt option available. These other options were ignored or not properly described by some firms that should have given proper debt advice. IVAs are the only debt solution in England, Wales and Northern Ireland that generates large fees for the firms setting them up. These fees can distort debt advice given … [Read more...]
IVAs and secured loans – how to complain
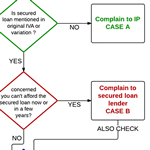
The IVA protocol, which applies to most new IVAs that started before July 2025, says that in the last year of your IVA, if you have a house with equity, you may have to release equity by either remortgaging or getting a secured loan. Most IVAs that started after July 2025 will use the "Protocol 2025" that does not require equity release, so this article is not relevant. Some of the proposed … [Read more...]
What happens at the end of your IVA? How long until it’s all finished?

If you are in the last few months of your IVA, you will be looking forward to making that last payment. It may feel a lot like getting to the finishing line of a marathon - and you may not be running so much as staggering over it. But when should you cancel your standing order? How long does it take to get your completion certificate? And when exactly are your debts written off, and how long … [Read more...]
Improving your credit score after an IVA

An IVA wrecks your credit record for at least six years. It can be longer than six years if your IVA doesn't complete within the 6 years, perhaps because you have had payment breaks. After your IVA finishes, in theory you don't need to do anything and all the problems will disappear from your record after the six year point... But it is important to check your IVA firm has closed down your … [Read more...]
Help with IVAs if you can’t pay because of the cost of living

Many people in an IVA are currently struggling because of the large rises in bills and prices in 2022. The Insolvency Service has now issued Guidance to support the IVA protocol. (That is confusingly laid out - look for the section headed 60) Guidance to support the IVA protocol for existing protocol compliant IVAs: 26 June 2022.) This sets out what extra help IVA firms should provide … [Read more...]