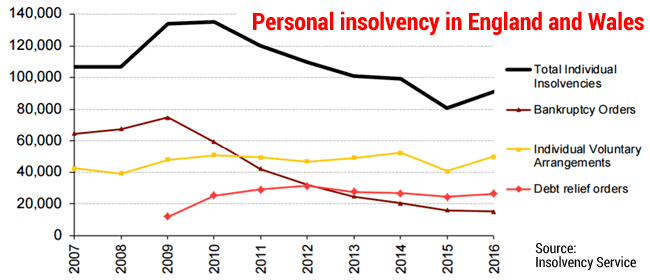
 On 27 January the Insolvency Service published the data on insolvency in 2016. The number of people who became insolvent in England and Wales last year was 90,930. As the graph above shows, this has reversed the trend of personal insolvency numbers falling every year: the total for 2016 is over 13% higher than in 2015, the first time there has been a rise since 2009.
Bank of England statistics show personal debt is increasing fast, National Debtline have reported their busiest January ever … it may appear that this is what is driving the increase in insolvency. And there have been a raft of news articles linking the two issues, for example, the BBC’s More going bust as personal borrowing surges.
But it takes time for higher borrowing to result in unmanageable debt and insolvency. Without some big macro-economic shock, the recent increases in unsecured lending are unlikely to affect the insolvency figures for several years.
Not a uniform rise
If the increase in insolvency was driven by general economic factors or by the mounting piles of personal unsecured debt, you would expect all three types of personal bankruptcy to have increased more or less together. But the following table shows that the three different sorts of personal insolvency were affected very differently in 2016:
| number in 2016 | % change on 2015 | |
|---|---|---|
| IVAs | 49,745 | +23% |
| DROs | 26,196 | +8% |
| Bankruptcy | 14,989 | -5% |
These differences make it highly unlikely that an increase in indebtedness is the major driver for the 2016 statistics. To explain them, we need to be looking not just for factors that may have increased the numbers of people with unmanageable debt in 2016, but also for the reasons why in 2016 the type of insolvency chosen has changed from previous years.
Here things get complicated: not all the issues point in the same direction and many can’t easily be quantified. But we can identify some factors as being important. And analysing the change in insolvency numbers turns out, in my opinion, to have implications for regulation and debt advice, so it is worth looking at this in detail.
I am only looking at the annual statistics, not the quarterly numbers. Because of the various changes in the rules for DROs and bankruptcy in 2015 and 2016, the quarterly data is complicated by people choosing to bring forward or delay insolvency – at least some of this noise is smoothed out at the annual level.
Personal problem debt in 2016
I think most people would agree with the following:
- the general economic climate in 2016 was relatively benign, not much changed from 2015. The number of company insolvencies was described by the Insolvency Service as broadly unchanged;
- employment may be up but real wages are still behind what they were in 2008. Combined with benefit cuts and rising rents this is resulting in a trend for people with debt problems having lower Disposable Incomes (DIs – the amount of money that is available to pay to non priority debts), particularly for the lower paid. The number of people with negative DIs is increasing;
- people coming to the free sector for debt advice are having more problems with priority debts and bills and fewer problems with consumer debts. Although increasing levels of consumer debt are a serious worry for the future, they are not yet causing an increase in problem debts.
(As an aside, these trends seem likely to continue in 2017, with recent/planned benefit cuts causing more problems, council tax rising and an increase in inflation following the decline in the exchange rate.)
Overall the result is that more people with previously manageable debts will have needed to look at a debt solution in 2016. DMPs take longer with lower DIs, so some increase in insolvency would be expected. But there is no reason to expect that the additional insolvencies will be concentrated in the IVA sector. Indeed, as the pressures have increased more for those on low incomes, many of whom have no assets, it might have been predicted that there would be a larger increase in DROs and bankruptcies than IVAs.
Factors affecting DRO applications
In October 2015, the cap on total debts going into a DRO was increased from £15,000 to £20,000. By making a wider number of people eligible, DRO numbers would be expected to rise in 2016.
The Insolvency Service has identified that about a quarter of DROs in 2016 involved cases which would previously have been excluded by the old limit. If nothing else had changed, this suggests that DROs in 2016 would have been expected to be about 23% higher than 2015 (taking into account that the last quarter of 2015 was also at the higher limit). The increase would have been smaller if the average size of debt had risen – so someone who in 2015 would have been under the 15k limit, in 2016 was over it – but this seems unlikely to be significant.
But the increase was only 8% in 2016. It seems likely that this headline increase is masking the fact that there has been a substantial decline in the number of people eligible for a DRO who have chosen one.
There are two possible explanations for this:
- some people who could benefit from a DRO are not taking debt advice at all. This has always been the case, but it may have got worse in 2016; and
- some people eligible for a DRO went for a different debt solution – which from the statistics would seem to be IVAs. To point out the obvious, there are NO good reasons why someone who is eligible for a DRO should choose an IVA.
Factors affecting bankruptcy applications
Bankruptcy is more complicated, with three different factors interacting:
- in October 2015 the minimum size for a creditor petition was increased from £750 to £5,000. As a result, creditor petitions for bankruptcy decreased by 12.6%;
- bankruptcy numbers would be expected to fall in 2016 with more people being eligible for a DRO, a simpler and cheaper option. It’s hard to put a number to this as the high bankruptcy fees could previously have been deterring this category of people from entering insolvency;
- in April 2016, debtor applications for bankruptcy were moved on-line. It was expected that some people would perceive this as being easier with less stigma, so it would be likely to increase the numbers choosing bankruptcy. As debtor applications only declined by 2.8%, considerably less than the number of people newly eligible for a DRO, it seems likely that this has happened.
Factors affecting IVAs
There have been no particular changes to IVA legislation or standard T&Cs that would account for the increase of 23%.
None of the DRO or bankruptcy specific factors discussed above seem likely to have a side effect of increasing IVAs. Less stigma attached to bankruptcy and higher DRO limits should, other things being equal, have been expected to reduce the numbers of people choosing an IVA.
But there have been changes in the way IVAs are sold in the last year. TDX has identified one of the reasons for IVA numbers increasing as “Mono-line personal insolvency providers who are not focused on FCA authorisation being able to invest in marketing and acquiring new customers.” As a result, the market shares of “older” and “newer” firms have been changing significantly.
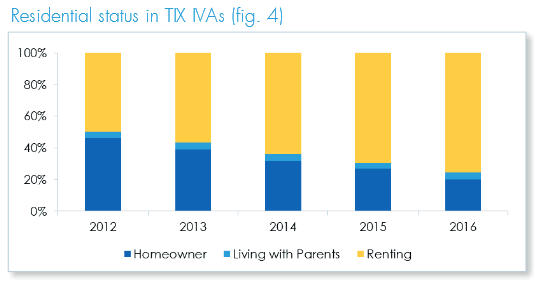
These newer customers tend to have less debt, more income from benefits and be renting. The average debt level in an IVA has more than halved since 2008. In 2012 only 50% of people in IVAs were renting, in 2016 that number had increased to 75%. 
Some firms are now advertising that £5,000 is an acceptable debt level, and DIs of £70 a month or even less are becoming more common. In other words, IVAs are now being marketed more, and some of the clients appear to be in what most debt advisers would think of as DRO territory.
I have looked before at the problems caused by the lack of regulation of IVA lead generators, and high on the list of these is the fact that lead generator websites tend to ignore DROs as an option completely. In a world where IVAs are aggressively advertised and DROs are not, this may account for both some of the increase in IVAs and the smaller increase in DROs than would have been expected after the change in DRO limits.
Previous DMP clients opting for insolvency
In 2016 many debt management firms have closed. The FCA identified at the start of its protracted debt management authorisation process that some people were in unsuitable DMPs because it would take too long to pay off their debts. As a result, many clients of closing firms may have switched to some form of insolvency. Some clients of debt management firms that are still in the business may also have switched.
This seems likely to be a significant factor behind the overall growth in insolvencies last year, explaining why, against a fairly unchanged economic background from the previous year, the numbers jumped in 2016. But it doesn’t explain why this increase appears to be concentrated in IVAs, especially against a background of falling DIs.
One of the few ways a firm exiting the debt management business had of making a profit from its soon to be ex-clients was by getting IVA referral fees. Suggesting bankruptcy or a DRO would not have generated any income. Although an IVA would have been a good option for many clients, it seems probable that some clients who were originally mis-sold a DMP, were last year mis-sold an IVA as a replacement.
So why have insolvency numbers increased?
Insolvency numbers didn’t increase in 2016 primarily because people were getting into more problem debt – the very different statistics for the three different types of insolvency suggest the picture is more complicated than that. Instead, the most important factors increasing the overall numbers of people choosing an insolvency option are likely to have been:
- for DROs, the increase in the debt limit made more people eligible, but the increase in DROs (8%) has been much lower than would be expected;
- for bankruptcy, the decline in numbers (-5%) has been caused by the higher creditor petition limit and some people now being eligible for DROs, partially offset by the new online bankruptcy application process being more attractive;
- for IVAs, the huge increase (23%) has resulted partly from the number of people who have switched to an IVA from a DMP and partly from increased marketing of IVAs as a debt solution.
These explanations are problematic for debt advisers and regulators, suggesting that some people are likely to have been mis-sold IVAs where DROs or bankruptcy would have been a better option.
More data would be helpful here. Has the FCA asked firms who withdrew their application for debt management authorisation to provide information about what their clients were told and where they were referred to? Have any of the RPBs or the Insolvency Service looked at the numbers of new IVAs in 2016 who could be potential candidates for DROs or bankruptcy? With the fragmented nature of IVA regulation, it may not be easy to get the full picture, but someone should be trying.


Leave a Reply